

Starting with the problem
Fleets in oil and gas face three stubborn headaches: asset visibility, unexpected costs, and safety gaps. For teams that manage long-distance hauls and remote site transfers, missing one piece of data can mean big delays and higher liability. I’ve seen this first-hand while working with operators around the Permian Basin, so let’s cut to the specifics that solve those headaches for oil and gas operations by using oil and gas fleet management that actually reports what matters.
What data points stop failures fast
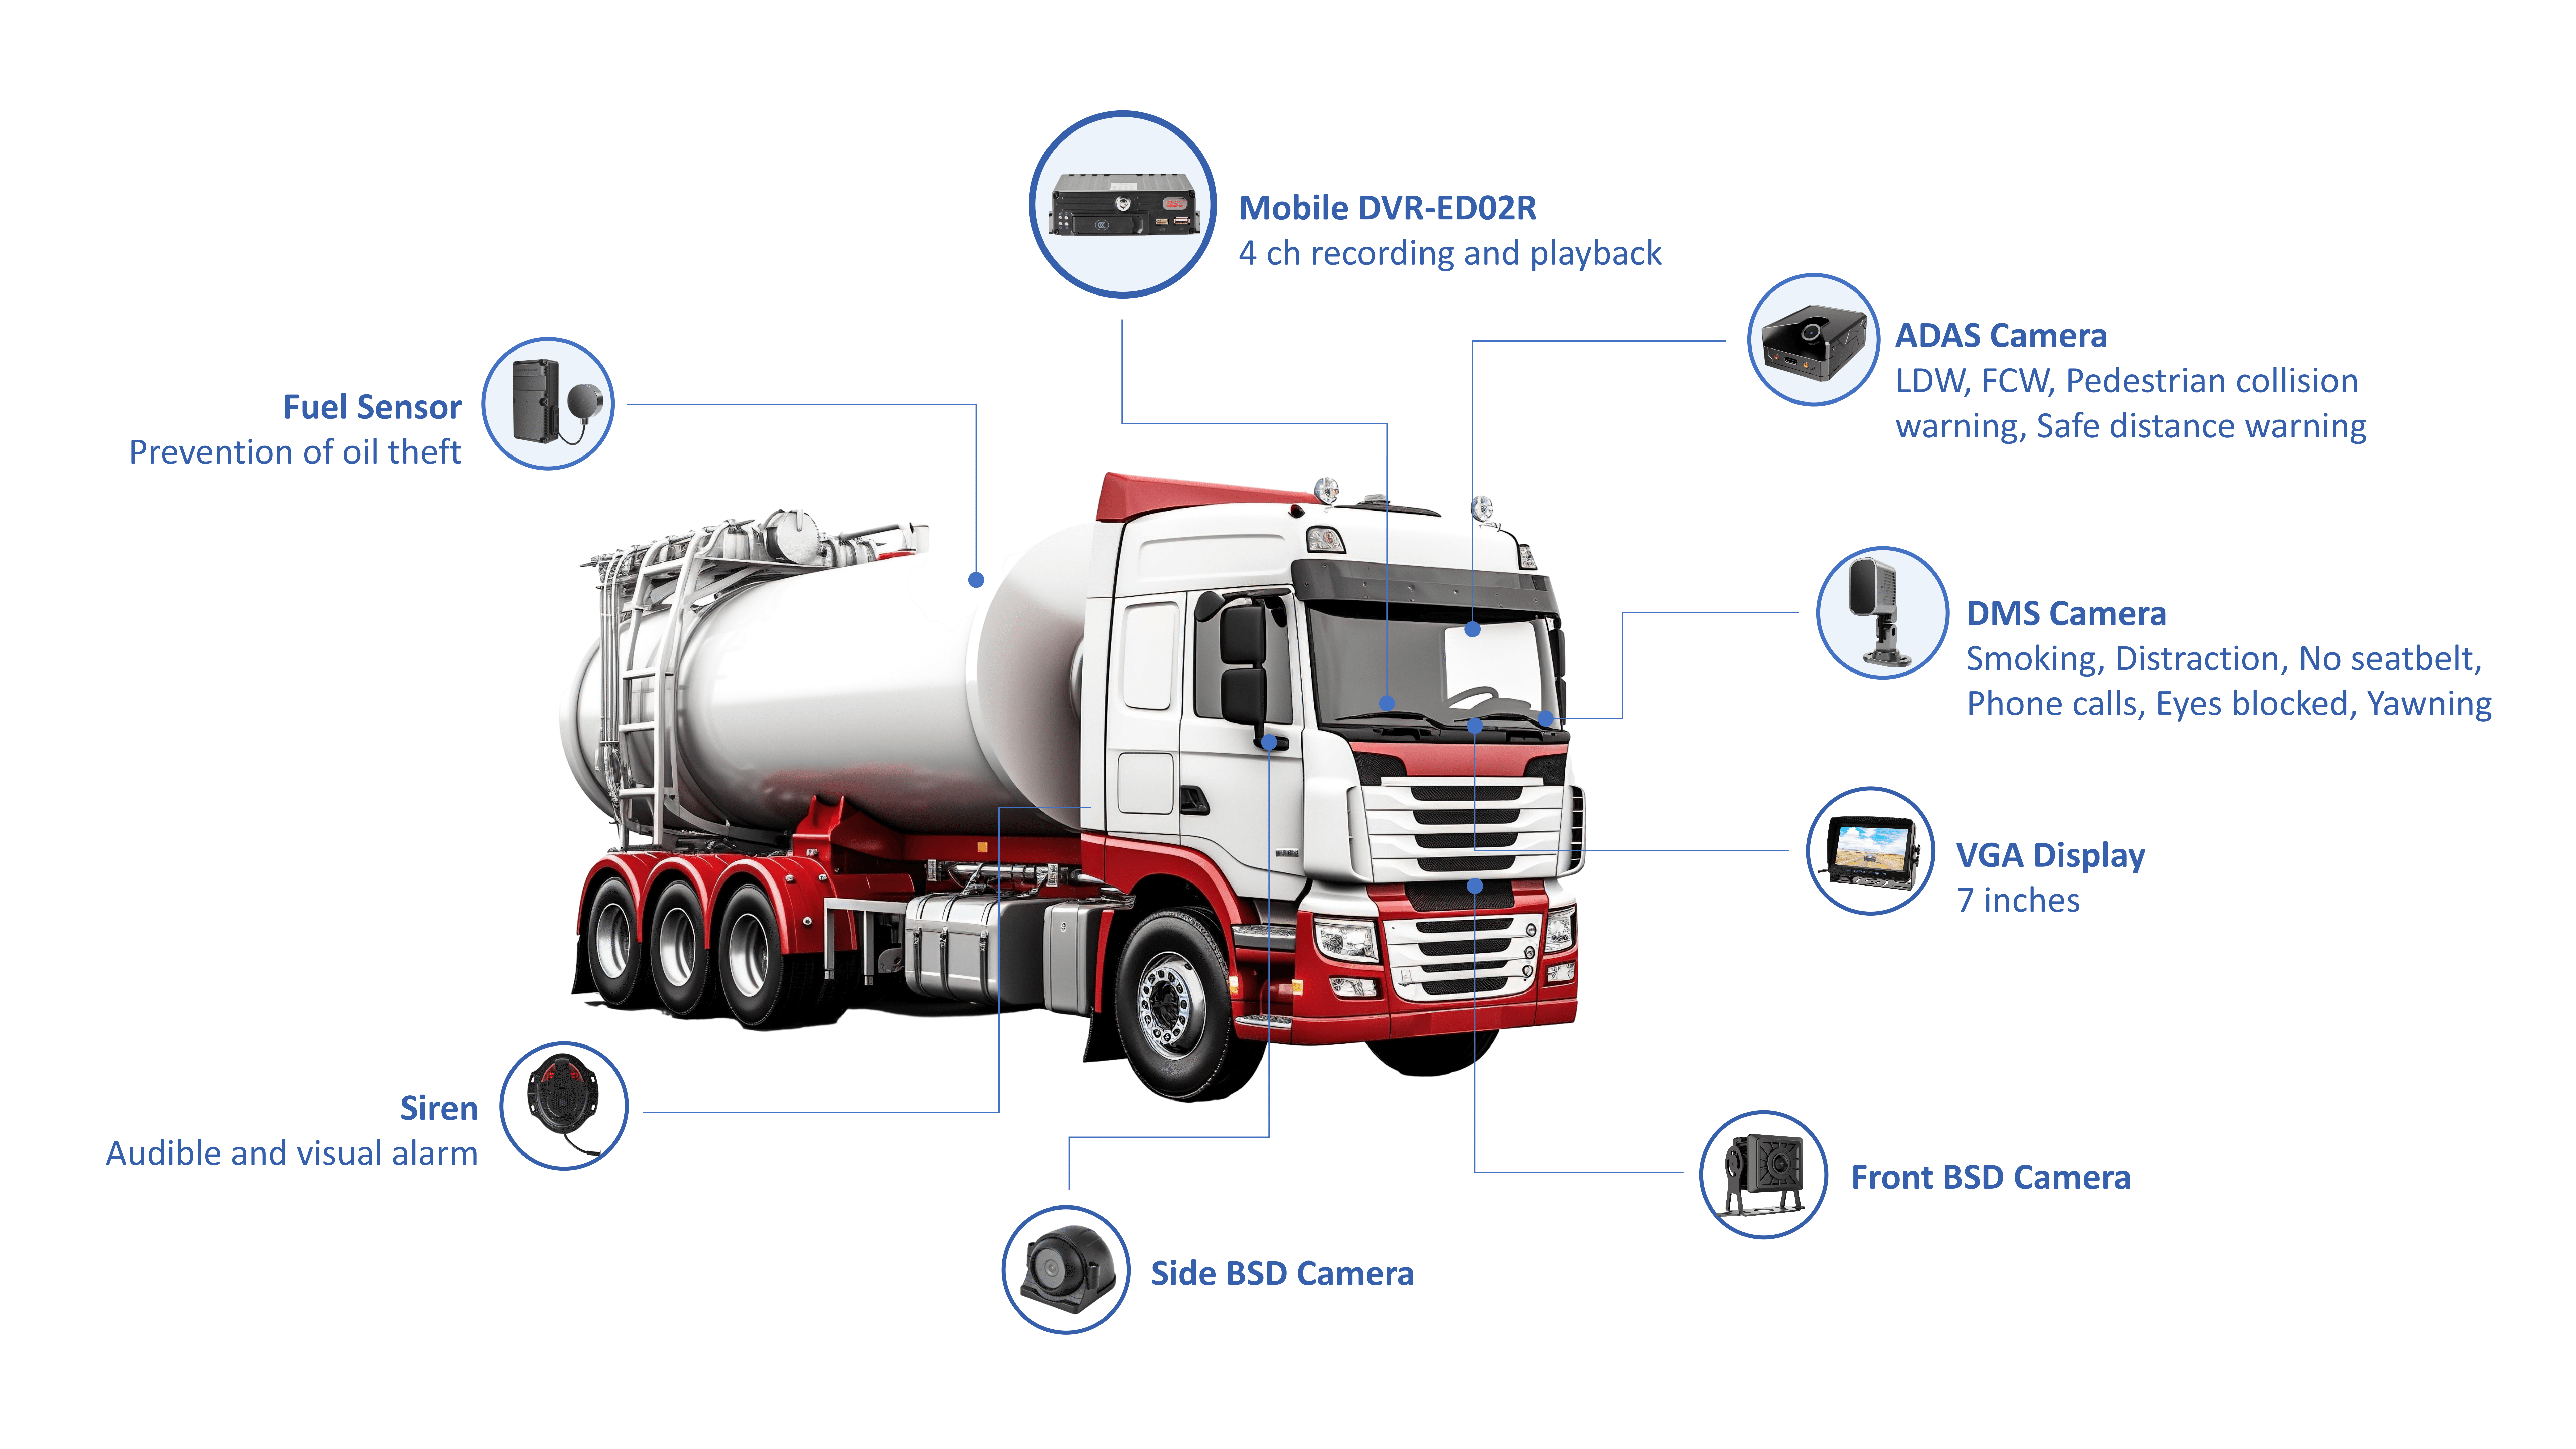
Track the signals that let you act before things break. Focus on:- Vehicle heartbeat: ignition, engine hours, odometer; – Maintenance triggers: diagnostic trouble codes, fluid levels, filter life; – Operational context: load type, route segment, dwell time at well sites; – Safety metrics: seatbelt use, harsh braking/acceleration, roll stability; – Compliance and fuel: hours-of-service, fuel consumption and discrepancy logs. These data points are the raw inputs for any credible fleet management for oil and gas report—without them you’re guessing.
Which KPIs actually change behavior
Pick KPIs that lead to actions, not vanity. Prioritize:- Mean time between failures (MTBF) for critical assets; – Cost per mile per vehicle, separated by payload class; – Percentage of missions on-time to scheduled well operations; – Incident rate per 100,000 miles and near-miss counts; – Fuel variance: expected vs. actual liters per route. These indicators let supervisors reroute, reschedule maintenance, or retrain drivers. Numbers are useful only when they prompt an immediate, clear step.

Reporting cadence and visualization that teams use
Don’t overdo frequency. Daily dashboards for operations, weekly maintenance rollups, and monthly executive summaries work better than constant noise. Visuals should show:- Trendlines with threshold bands; – Route heat maps highlighting repeated delays; – Maintenance backlog with confidence windows. Keep tables for auditors and simple charts for crew leads. Reports must be readable on a phone at a remote pad; if crews can’t parse it in two swipes, it’s useless.
Common mistakes operators make
Three predictable errors derail telematics programs:- Collecting every metric but acting on none; – Trusting raw GPS alone for route and idle time; – Treating telematics as a policing tool rather than a support tool. Avoid siloed reports: maintenance, ops, and HSE should see tailored views from the same data source. When teams share a single truth, decisions happen faster and with less friction.
How to validate your system and build trust
Validate by cross-checking telematics with simple physical audits: compare fuel receipts against telematics fuel variance for a sample week; shadow three drivers for a shift and reconcile route telemetry. Trust grows when reports match reality often enough that crews stop questioning the numbers. I’ve advised teams who reduced unscheduled downtime by aligning telematics KPIs to planned maintenance windows, and that practical alignment convinces skeptics better than policy memos.
Final synthesis
Start with the problem you need to solve, limit tracked metrics to those that trigger action, and deliver reports in the cadence your crews will use. Do that and telematics becomes a daily tool for safer, cheaper, more predictable operations—especially in demanding oilfield contexts. For operators who need practical integration and honest reporting at scale, BSJ fits into workflows without theatrical change, giving teams clear data they can trust and use immediately.